Data Analytics - Week 3
Review
four steps of data analysis
Call -> Examine -> Process -> Visualize
import pandas as pd
import matplotlib.pyplot as plt

enroll = pd.read_csv('./data/enrolleds_detail.csv')

enroll_detail = enroll.groupby('lecture_id')['user_id'].count()

plt.rcParams['font.family'] = 'Malgun Gothic'

enroll_detail.sort_values(ascending=False)

lectures = pd.read_csv('./data/lectures.csv')

lecture_count = pd.DataFrame(enroll_detail)

lecture_count = lecture_count.reset_index()

lecture_count = lecture_count.rename(columns={'user_id':'count'})

lectures = lectures.set_index('lecture_id')

full_lecture = lecture_count.join(lectures, on='lecture_id')

plt.figure(figsize=(22, 5))
plt.bar(full_lecture['title'], full_lecture['count'])
plt.xticks(rotation=90)
plt.show()
That is the shortcut to what I have learned in the past two weeks. It may not look like much, but I think being able to draw a graph using python is phenomenal.
WordCloud

Wordcloud is one of the most vivid visualizations of data using python. However, some words may appear very small and hard to perceive at times.
Downloading wordcloud
conda install -c conda-forge wordcloud
Importing all necessary modules
import numpy as np
from PIL import Image
from wordcloud import WordCloud
import matplotlib.pyplot as plt
Using functions to compile files
result = ""
for num in range(1, 15):
    index = '{:02}'.format(num) # 2 digit, replace with 0 if none
    filename = "Sequence_"+index+".txt"
    text = open('./data/'+filename, 'r', encoding='utf-8-sig')
    result += text.read().replace("\n", " ")
Regular expression to remove special characters
import re

pattern = '[^\w\s]' # It's just a promise to do this to remove special characters

text = re.sub(pattern=pattern, repl='', string=result)
# pattern is to remove special characters
# repl is to replace the removed characters
# string is the input
Font Families
I'm a Korean, so in order to use Korean in matplotlib I have to check which font families are available by using the code below:
import matplotlib.font_manager as fm
for f in fm.fontManager.ttflist:
    if 'Gothic' in f.name:
        print(f.fname)
This would print the paths to the fonts I want. Copy and paste one of them into font_path and run the code below:
font_path = 'C:\Windows\Fonts\malgunsl.ttf'

wc = WordCloud(font_path=font_path, background_color="white")
wc.generate(text)

plt.figure(figsize=(50,50))
plt.axis("off")
plt.imshow(wc)
plt.show()
However, this only creates a wordcloud in a shape of a square. in order to make it so it belongs in a shape you want, you need to:
# Generate a word cloud image
mask = np.array(Image.open('./data/sparta.png'))
wc = WordCloud(font_path=font_path, background_color="white", mask=mask)
wc.generate(text)

f = plt.figure(figsize=(50,50))
f.add_subplot(1,2, 1)
plt.imshow(mask, cmap=plt.cm.gray)
plt.title('Original Stencil', size=40)
plt.axis("off")
f.add_subplot(1,2, 2)
plt.imshow(wc, interpolation='bilinear')
plt.title('Sparta Cloud', size=40)
plt.axis("off")
plt.show()
Saving WordCloud to file
mask = np.array(Image.open('./data/sparta.png'))
wc = WordCloud(font_path=font_path, background_color="white", mask=mask)
wc.generate(text)

f = plt.figure(figsize=(50,50))
plt.imshow(wc, interpolation='bilinear')
plt.title('my word cloud', size = 40)
plt.axis("off")
plt.show()
f.savefig('./data/myWordCloud.png')
Properly formatting data
# formatting data
format = '%Y-%m-%dT%H:%M:%S.%f' # year, month, date, hour, minute, seconds
sparta_data['done_date_time']=pd.to_datetime(sparta_data['done_date'], format=format)

# Categorizing by day name
sparta_data['day']=sparta_data['done_date_time'].dt.day_name()

weekdata = sparta_data.groupby('day')['user_id'].count()

# Putting it in right order
weeks = ['Monday', 'Tuesday', 'Wednesday', 'Thursday', 'Friday', 'Saturday', 'Sunday']
weekdata = weekdata.agg(weeks)

# Extracting time from data
sparta_data['done_date_time_hour'] = sparta_data['done_date_time'].dt.hour

hour_data = sparta_data.groupby('done_date_time_hour')['user_id'].count()

hour_data = hour_data.sort_index()

# Use of np.arange

np.arange(0, 23) # makes a range between 0 and 23

# Creating pivot tables

pivot_table=pd.pivot_table(sparta_data, values='user_id', aggfunc='count', index=['day'], columns=['done_date_time_hour']).agg(weeks)

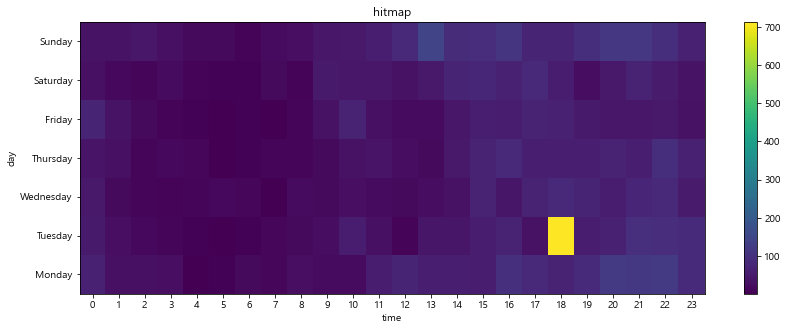
# Creating hitmap

plt.figure(figsize=(14, 5))
plt.pcolor(pivot_table)
plt.title('hitmap')
plt.xlabel('time')
plt.ylabel('day')
plt.xticks(np.arange(0.5, len(pivot_table.columns), 1), pivot_table.columns)
plt.yticks(np.arange(0.5, len(pivot_table.index), 1), pivot_table.index)
plt.colorbar()
plt.show()

Review of what I've learned this week
WordClouds
lyrics=open('./data/mysong.txt', 'r', encoding='utf-8-sig')

result = lyrics.read().replace('\n', ' ')

mask = np.array(Image.open('./data/cartoon-rock-musician.jpg'))
font_path='C:\Windows\Fonts\malgunsl.ttf'
wc=WordCloud(font_path=font_path, background_color="white", mask=mask)
wc.generate(result)

plt.figure(figsize=(50, 50))
plt.axis("off")
plt.imshow(wc)
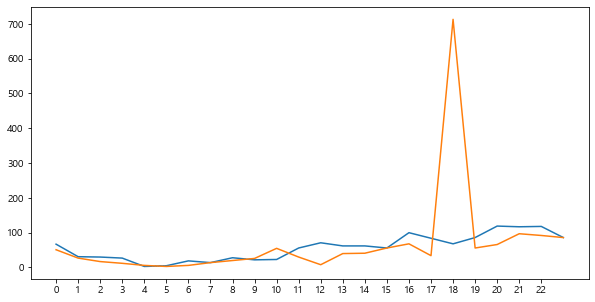
Data Analyzation
monday = sparta_data[sparta_data['day']=='Monday']
tuesday = sparta_data[sparta_data['day']=='Tuesday']

monday = monday.groupby('done_date_time_hour').count()['user_id']
tuesday = tuesday.groupby('done_date_time_hour').count()['user_id']

plt.figure(figsize=(10, 5))
plt.plot(monday.index, monday)
plt.xticks(np.arange(0, 23))
plt.plot(tuesday.index, tuesday)
plt.xticks(np.arange(0, 23))
plt.show()

Thoughts
I really am being sluggish these days, especially with overloaded schedules. I haven't even written thoughts in my previous blogs for a while. I am learning, but due to sporadic check-ins, I'm forgetting some of the codes and losing the skills that I used to have. I think I should get back to my routine of being productive.